Debugging your add-to-app module
Debugging your add-to-app module
Once you’ve integrated the Flutter module to your project and used Flutter’s platform APIs to run the Flutter engine and/or UI, you can then build and run your Android or iOS app the same way you run normal Android or iOS apps.
However, Flutter is now powering the UI in places where you’re showing a
FlutterActivity or FlutterViewController.
Debugging
You may be used to having your suite of favorite Flutter debugging tools
available to you automatically when running flutter run or an equivalent
command from an IDE. But you can also use all your Flutter
debugging functionalities such as hot reload, performance
overlays, DevTools, and setting breakpoints in add-to-app scenarios.
These functionalities are provided by the flutter attach mechanism.
flutter attach can be initiated through different pathways,
such as through the SDK’s CLI tools,
through VS Code or IntelliJ/Android Studio.
flutter attach can connect as soon as you run your FlutterEngine, and
remains attached until your FlutterEngine is disposed. But you can invoke
flutter attach before starting your engine. flutter attach waits for
the next available Dart VM that is hosted by your engine.
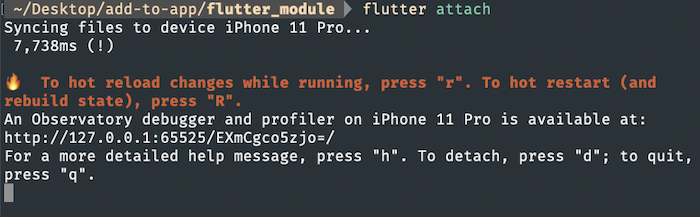
Terminal
Run flutter attach or flutter attach -d deviceId to attach from the terminal.
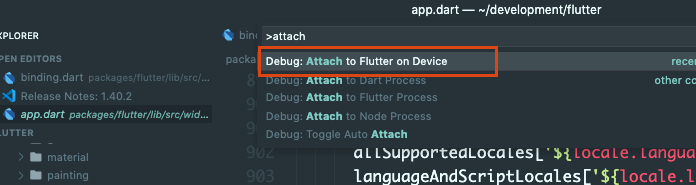
VS Code
Select the correct device using the status bar in VS Code, then run the Flutter: Attach to Flutter on Device command from the command palette.
Alternatively, create a .vscode/launch.json file in your Flutter module project to enable attaching using the Run > Start Debugging command or F5:
{
  name: "Flutter: Attach",
  request: "attach",
  type: "dart",
}
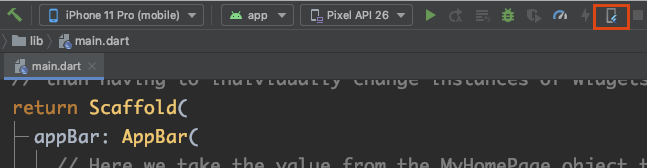
IntelliJ / Android Studio
Select the device on which the Flutter module runs so flutter attach filters for the right start signals.