Using the Performance view
What is it?
The performance view offers timing and performance information for activity in your application. It consists of three parts, each increasing in granularity.
- Flutter frames chart (Flutter apps only)
- Timeline events chart
- CPU profiler
The performance view also supports importing and exporting of data snapshots. For more information, see the Import and export section.
Flutter frames chart
This chart contains Flutter frame information for your application. Each bar set in the chart represents a single Flutter frame. The bars are color-coded to highlight the different portions of work that occur when rendering a Flutter frame: work from the UI thread and work from the raster thread (previously known as the GPU thread).
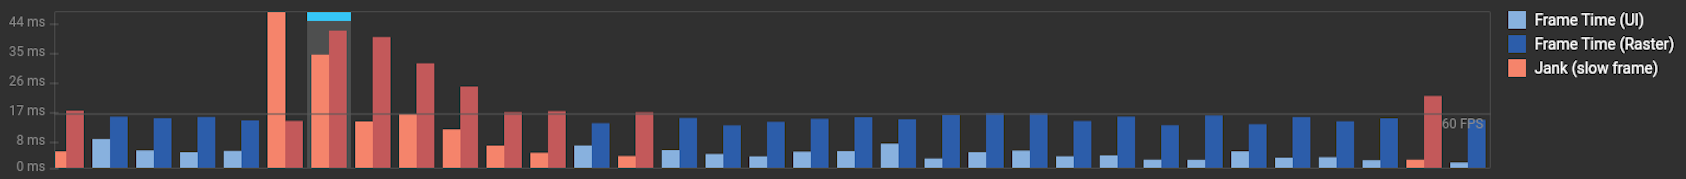
Selecting a bar from this chart centers the flame chart below on the timeline events corresponding to the selected Flutter frame. The events are highlighted with blue brackets.
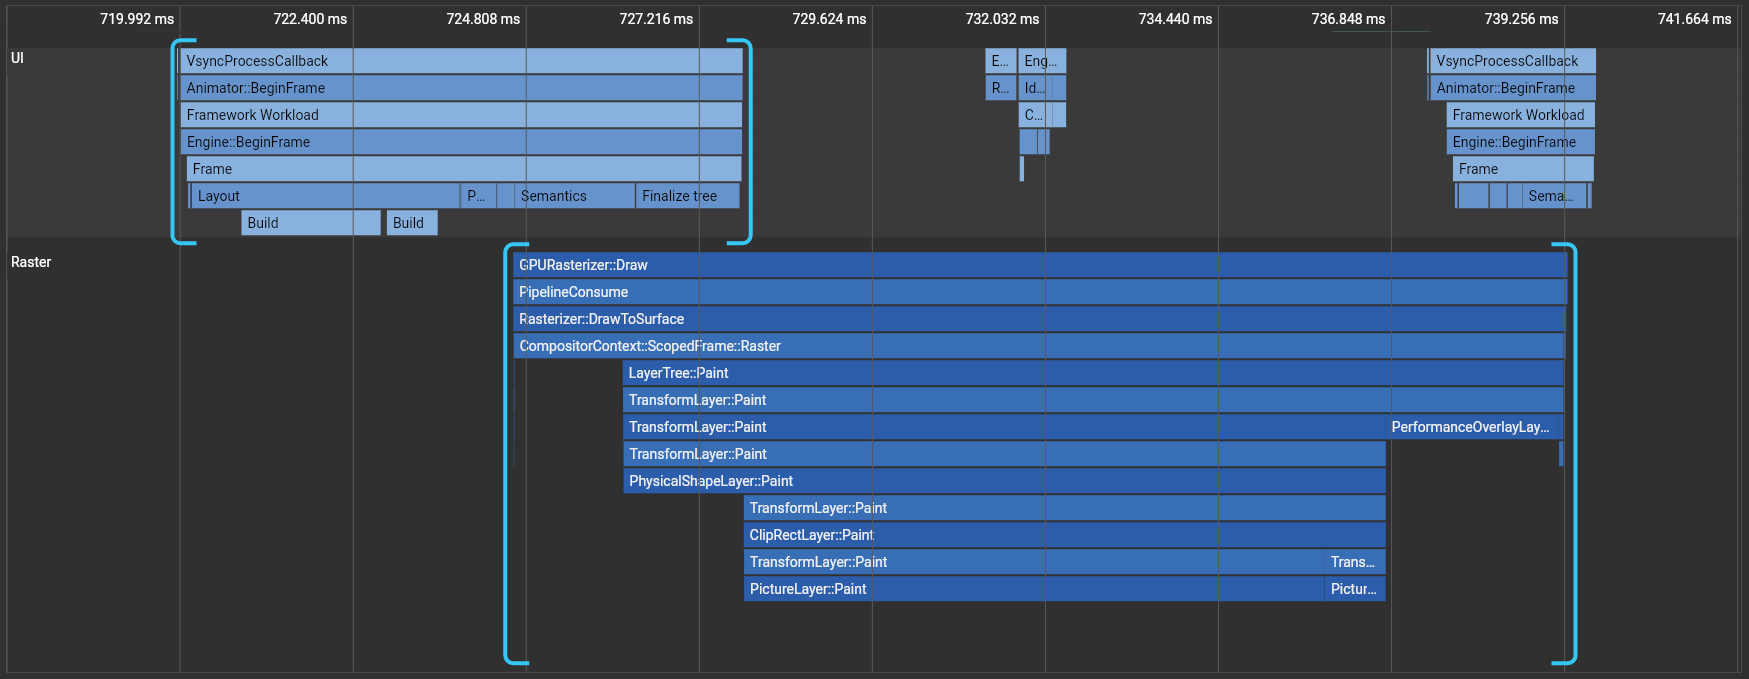
UI
The UI thread executes Dart code in the Dart VM. This includes code from your application as well as the Flutter framework. When your app creates and displays a scene, the UI thread creates a layer tree, a lightweight object containing device-agnostic painting commands, and sends the layer tree to the raster thread to be rendered on the device. Do not block this thread.
Raster
The raster thread (previously known as the GPU thread) executes graphics code from the Flutter Engine. This thread takes the layer tree and displays it by talking to the GPU (graphic processing unit). You cannot directly access the raster thread or its data, but if this thread is slow, it’s a result of something you’ve done in the Dart code. Skia, the graphics library, runs on this thread.
Sometimes a scene results in a layer tree that is easy to construct,
but expensive to render on the raster thread. In this case, you
need to figure out what your code is doing that is causing
rendering code to be slow. Specific kinds of workloads are more
difficult for the GPU. They might involve unnecessary calls to
saveLayer(), intersecting opacities with multiple objects,
and clips or shadows in specific situations.
For more information on profiling, see Identifying problems in the GPU graph.
Jank
The frame rendering chart shows jank with a red overlay. A frame is considered to be janky if it takes more than ~16 ms to complete (for 60 FPS devices). To achieve a frame rendering rate of 60 FPS (frames per second), each frame must render in ~16 ms or less. When this target is missed, you may experience UI jank or dropped frames.
For more information on how to analyze your app’s performance, see Flutter performance profiling.
Timeline events chart
The timeline events chart shows all event tracing from your application. The Flutter framework emits timeline events as it works to build frames, draw scenes, and track other activity such as HTTP traffic. These events show up here in the Timeline. You can also send your own Timeline events via the dart:developer Timeline and TimelineTask APIs.
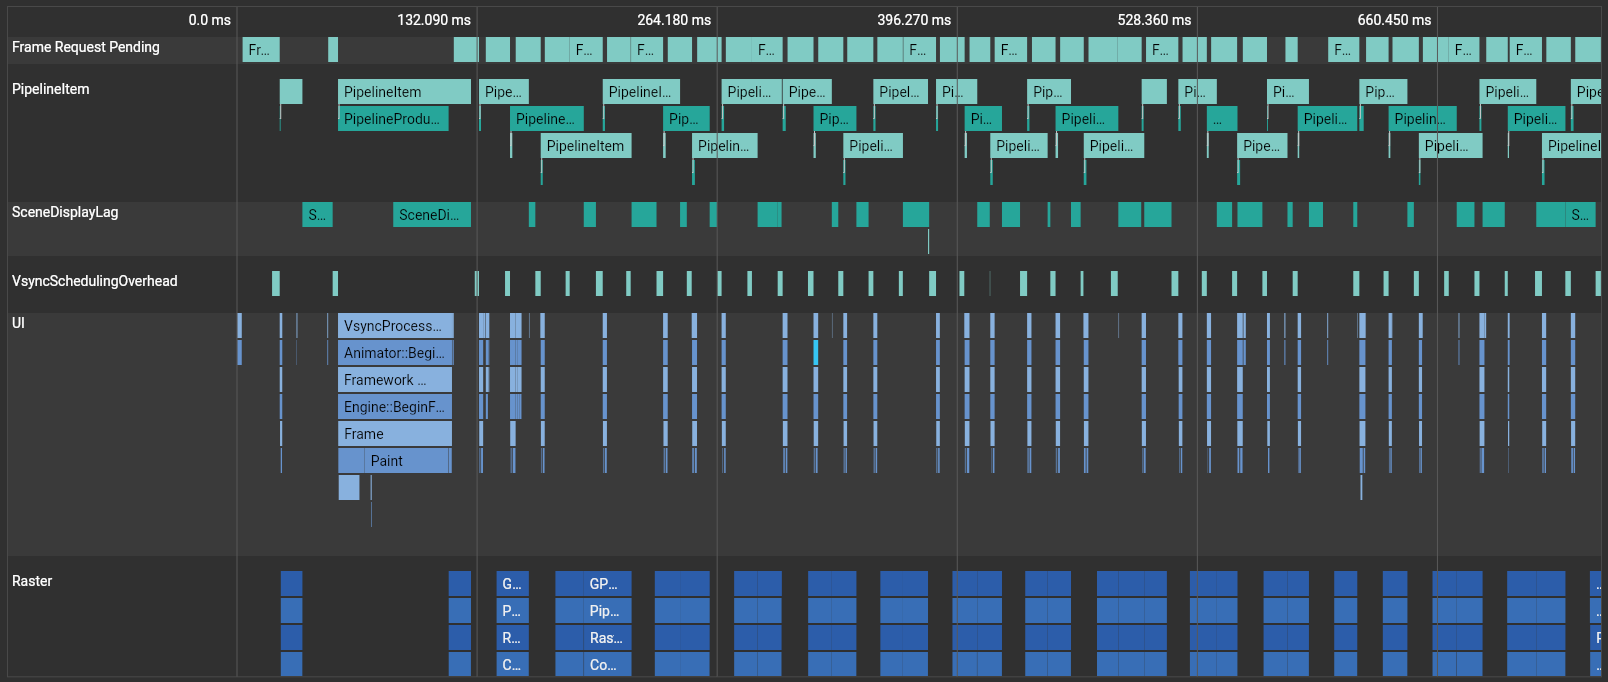
The flame chart supports zooming and panning:
- To zoom, scroll up and down with the mouse wheel / trackpad
- To pan horizontally, either click and drag the chart or scroll horizontally with the mouse wheel / trackpad
- To pan vertically, either click and drag the chart or use alt + scroll
- The WASD keys also work for controlling zoom and horizontal scroll position
You can click an event to view CPU profiling information in the CPU profiler below, described in the next section.
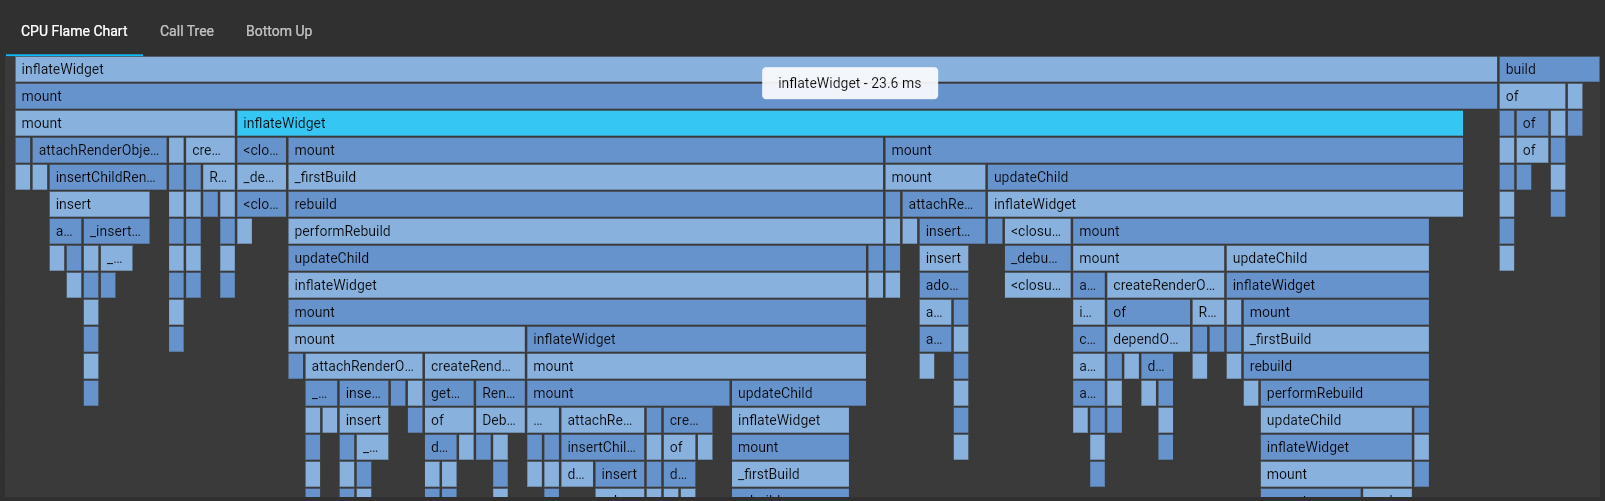
CPU Profiler
Start recording a CPU profile by clicking Record. When you are done recording, click Stop. At this point, CPU profiling data is pulled from the VM and displayed in the profiler views (Call Tree, Bottom Up, and Flame Chart).
Profile granularity
The default rate at which the VM collects CPU samples is 1 sample / 250 μs. This is selected by default on the CPU profiler view as “Profile granularity: medium”. This rate can be modified via the selector at the top of the page. The sampling rates for low, medium, and high granularity are 1 / 1000 μs, 1 / 250 μs, and 1 / 50 μs, respectively. It is important to know the trade-offs of modifying this setting.
A higher granularity profile has a higher sampling rate, and therefore yields a fine-grained CPU profile with more samples. This may also impact performance of your app since the VM is being interrupted more often to collect samples. This also causes the VM’s CPU sample buffer to overflow more quickly. The VM has limited space where it can store CPU sample information. At a higher sampling rate, the space fills up and begins to overflow sooner than it would have if a lower sampling rate was used. This means that you may not have access to CPU samples from the beginning of the recorded profile.
A lower granularity profile has a lower sampling rate, and therefore yields a coarse-grained CPU profile with fewer samples. However, this impacts your app’s performance less. The VM’s sample buffer also fills more slowly, so you can see CPU samples for a longer period of app run time. This means that you have a better chance of viewing CPU samples from the beginning of the recorded profile.
Flame chart
This tab of the profiler shows CPU samples for the recorded duration. This chart should be viewed as a top-down stack trace, where the top-most stack frame calls the one below it. The width of each stack frame represents the amount of time it consumed the CPU. Stack frames that consume a lot of CPU time may be a good place to look for possible performance improvements.
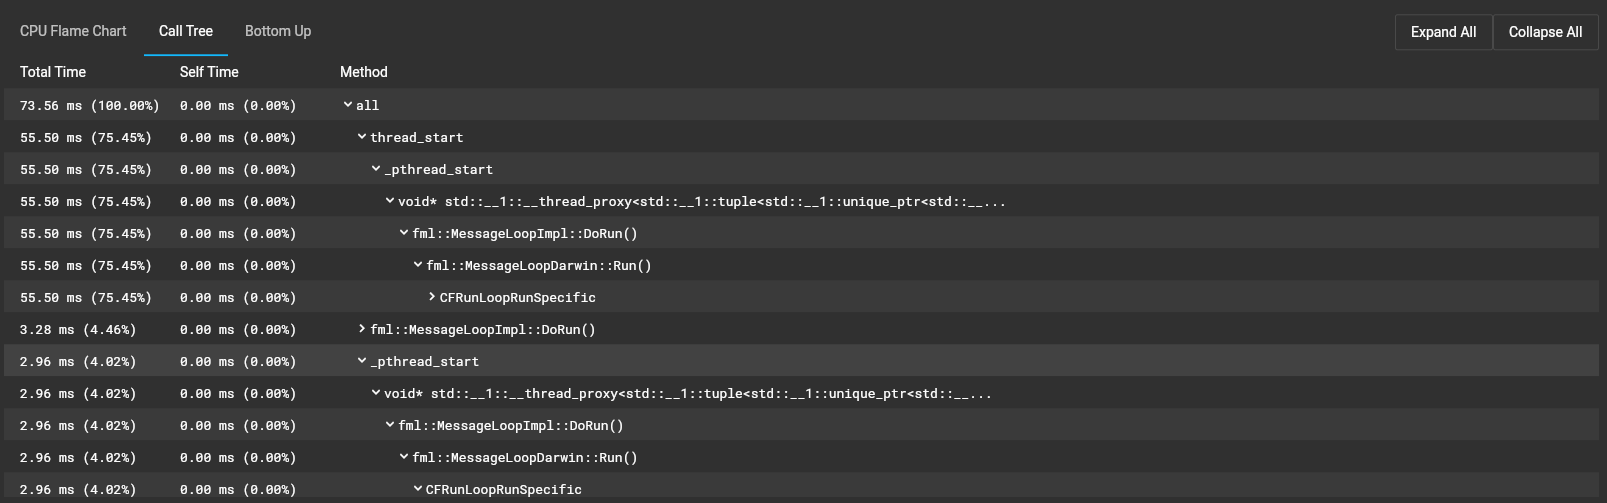
Call tree
The call tree view shows the method trace for the CPU profile. This table is a top-down representation of the profile, meaning that a method can be expanded to show its callees.
- Total time
- Time the method spent executing its own code as well as the code for its callees.
- Self time
- Time the method spent executing only its own code.
- Method
- Name of the called method.
- Source
- File path for the method call site.
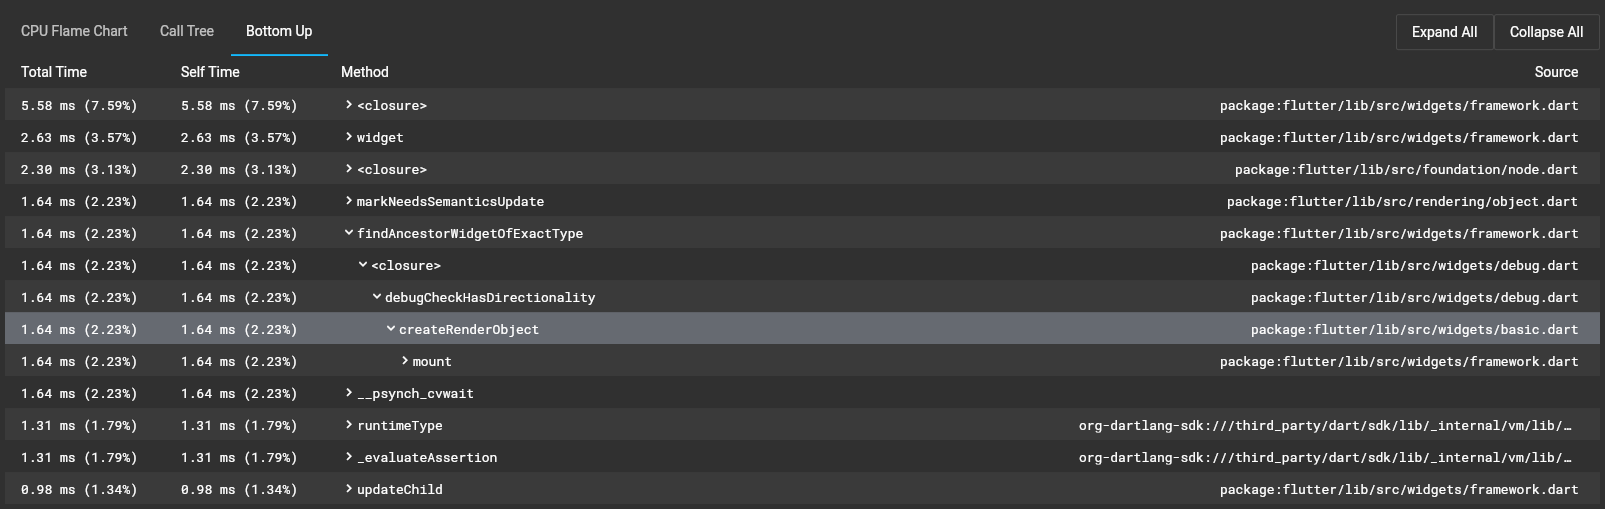
Bottom up
The bottom up view shows the method trace for the CPU profile but, as the name suggests, it’s a bottom-up representation of the profile. This means that each top-level method in the table is actually the last method in the call stack for a given CPU sample (in other words, it’s the leaf node for the sample).
In this table, a method can be expanded to show its callers.
- Total time
-
Time the method spent executing its own code as well as the code for its callee.
- Self time
-
For top-level methods in the bottom-up tree (leaf stack frames in the profile), this is the time the method spent executing only its own code. For sub nodes (the callers in the CPU profile), this is the self time of the callee when being called by the caller. In the following example, the self time of the caller
createRenderObjectis equal to the self time of the calleedebugCheckHasDirectionalitywhen being called by the caller. - Method
-
Name of the called method.
- Source
-
File path for the method call site.
Import and export
DevTools supports importing and exporting performance snapshots. Clicking the export button (upper-right corner above the frame rendering chart) downloads a snapshot of the current data on the performance page. To import a performance snapshot, you can drag and drop the snapshot into DevTools from any page. Note that DevTools only supports importing files that were originally exported from DevTools.