Using the Memory view
- What is it?
- DevTools memory page
- Charting memory statistics and events
- Analysis and snapshots
- Allocations and tracking
- Memory anatomy
- Memory overview chart
- Memory controls
- Memory actions
- Snapshots
- Inspecting a class instance in a snapshot
- Analysis of a snapshot
- Allocation tab
- Allocation tracking
- Filtering, Searching and Auto-Complete
- Memory problem case study
- Glossary of VM terms
What is it?
Allocated Dart objects created using a class constructor (for
example, by using new MyClass() or MyClass()) live in a
portion of memory called the heap. The memory in the heap is
managed by the Dart VM (virtual machine).
DevTools memory page
DevTools Memory page lets you peek at how an isolate is using memory at a given moment.
Memory profiling in DevTools consists of 3 main functions:
- Charting memory usage statistics and events
- Anaylsis to view all memory via a heap to detect memory issues and inspect objects
- Allocations to monitor and track (stack trace) specific classes and objects when an allocation occurs
Charting memory statistics and events
At the top-level, when the memory tab is selected memory statistics from
the VM are collected. These statistics are displayed in the two overview
charts (Dart memory and Android-only) the collection of general memory
usage e.g., total heap used, external heap, maximum heap capacity,
Resident Set Size (RSS). As you interact with your application various
events are detected e.g., memory GC (garabage collection),Flutter events,
user fired events (using the dart:developer package) are collected
in the same timeline as the memory statistics. All of this collected
statistics and events are displayed in charts see Memory anatomy.
Analysis and snapshots
A Snapshot is a complete, the most complex and time consuming view of all objects in the Dart memory heap. Each time a snapshot is taken, an analysis is performed over the collected memory data. The analysis attempts to identify any memory patterns that may cause leaks or lead to application crashes. For example, loading large assets for thumbnail-sized images inefficiently, memory usage can be improved by loading smaller assets or adjusting the cacheWidth/cacheHeight to decode an image to a smaller size reducing the memory usage of the ImageCache. The analysis catches issues like this see Analysis tab.
Allocations and tracking
Monitoring all allocations involes you directly interacting with DevTools and your application to isolate a short period of time that you are interested in knowing how many objects were allocated, how many bytes were allocated, or tracking all the places in your code where a particular class is allocated. This information is available under the “Allocations” tab of Memory profiler and his a fairly fast with less overhead than using a snapshot.
Monitoring allocations and resetting of accumulators, helps to analyze the accumulator counts (number of objects or bytes allocated) in a short timeframe between a reset and monitor Track events. The accumulators can be used to understand the rate of memory allocations. If you suspect your application is leaking memory or has other bugs relating to memory allocation. Additionally, the ability to track a few specific classes, too many may slow the running of your application. The VM records the stack trace at the time a class’ constructor (allocation) is called. This can isolate the exact location in your code when/where memory is being allocated. See Allocation tab.
Memory anatomy
A timeseries graph is used to visualize the state of the Flutter memory at successive intervals of time. Each data point on the chart corresponds to the timestamp (x-axis) of measured quantities (y-axis) of the heap, for example, usage, capacity, external, garbage collection, and resident set size.

Events Pane
The event timeline displays Dart VM and DevTools events on a shared timeline. These events can be snapshots (manual and auto), Dart VM GCs, user requested GCs, or monitor and accumulator reset actions.

This chart displays DevTools events (such as manual GC, VM GC, Snapshot, monitor Allocations Track and Reset of accumulators button clicks) in relation to the memory chart timeline. Clicking over the markers in the Event timeline displays a hover card of the time when the event occurred. This may help identify when a memory leak might have occurred in the timeline (x-axis).
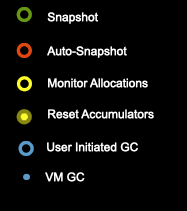
This legend shows the symbol for each DevTools event and its meaning
- Snapshot
-
User initiated snapshot—all memory information collected and an analysis performed.
- Auto-Snapshot
-
DevTools initiated a snapshot detecting that memory grow by 40% or more from previous size. This is used to quickly detect memory spikes in your Flutter application for later analysis (same information collected in a manual snapshot).
- Track
-
Collects current state of all active classes number of instances and byte size of all instances. In addition, the deltas are the change in the accumulators since the last “Reset” button pressed.
- Reset
-
When both the instance and bytes accumulators were reset to zero.
- User Initiated GC
-
User initiated request to VM to to perform a garbage collection of memory (only a suggestion to the VM).
- VM GC
-
GC (VM garbage collection) has occurred, frees space no longer used. For more information on how Dart performs garbage collection, see Don’t Fear the Garbage Collector.
- User and Flutter Event
- Displayed as a triangle in the event pane. The dark magenta triangle "Multiple Flutter or User Events"
- identifies more than one event was received at this timestamp. The lighter magenta triangle "One Flutter or User Event"
- indicates only one event was received at this timestamp. To view the events clicking on the triangle will display a hover card and expanding the events at the bottom of the hovercard will display all events for that timestamp.


Displayed below the events pane is the memory chart and the Android memory chart. The android-memory chart is specific to an Android app, and it shows Android ADB meminfo from an ADB app summary.
Adding user custom events to the timeline
Sometimes it may be difficult to correlate the actions in your Flutter application code and the collected memory statistics/events charted in the Memory timeline/chart. To help know what’s happening in your code your own events can be injected into the Memory Profile timeline to help to understand how your application’s memory usage is performing within the Dart/Flutter framework (heap).
Posting your own custom event(s) are done using the dart:developer package postEvent method. In particular, the event name must be prefixed with DevTools.Event_ then your event name would be appended e.g., DevTools.Event_MyEventName
To use add the following import to your code:
import 'dart:developer' as developer;
and a method to post custom event(s) to the Memory timeline:
  void devToolsPostEvent(String eventName, Map<String, Object> eventData) {
    developer.postEvent('DevTools.Event_$eventName', eventData);
  }
Then to post an event from your code you would call the devToolsPostEvent e.g. In your function recordLoadedImage you could cause the ‘MyImages’ event to be posted to the Memory (event) timeline with the values method and param (the URL).
  Widget recordLoadedImage(ImageChunkEvent imageChunkEvent, String imageUrl) {

    // Record the event in the memory event pane.
    devToolsPostEvent('MyFirstApp', { 'method': 'recordLoadedImage', 'param': imageUrl });

    if (imageChunkEvent == null) return null;

    ...

  }
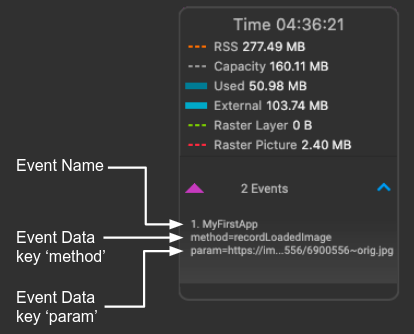
Clicking on the aggregated event triangle in the event pane will dispay a hover card with the details of all events e.g., two custom events at the timestamp 04:36:21 with the event name ‘MyFirstApp’ and the two eventData entries method and param are displayed with their values:
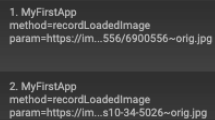
Scrolling the events displays:
Memory overview chart
A timeseries graph of collected memory statistics, to visualize the state of the Dart/Flutter heap and Dart/Flutter native memory over time.
The chart’s x-axis is a timeline of events (timeseries). The data plotted in the y-axis all have a timestamp when the data was collected. In other words, it shows the polled state (capacity, used, external, RSS (resident set size), and GC (garbage collection)) of the memory every 500 ms. This helps give a live appearance on the state of the memory as the application is running.
Clicking on the Legend button describes the collected measurements and symbols/colors used to display the data.

The Memory Size Scale Y axis scale automatically adjusts to the range of data collected in the current visible chart range.
The quantities plotted on the y-axis are:
Dart/Flutter Heap Objects (Dart/Flutter objects) in the heap.
Dart/Flutter Native Memory that is not in the Dart/Flutter heap but is still part of the total memory footprint. Objects in this memory would be native objects (for example, from a memory read from a file, or a decoded image). The native objects are exposed to the Dart VM from the native OS (such as Android, Linux, Windows, iOS) using a Dart embedder. The embedder creates a Dart wrapper with a finalizer, allowing Dart code to communicate with these native resources. Flutter has an embedder for Android and iOS. For more information, see Dart on the Server or Custom Flutter Engine Embedders.
Timeline The timestamps of all collected memory statistics and events at a particular point in time (timestamp).
Raster Cache Size of the Flutter engine’s raster cache layer(s) or picture(s) while performing the final rendering after compositing. See Flutter Architectural Overview and DevTools Performance.
Allocated Current capacity of the heap is typically slightly larger than total size of all heap objects.
RSS - Resident Set Size The resident set size displays the amount of memory for a process. It doesn’t include memory that is swapped out. It includes memory from shared libraries that are loaded, as well as all stack and heap memory.
For more information, see Dart VM internals.
Hover card
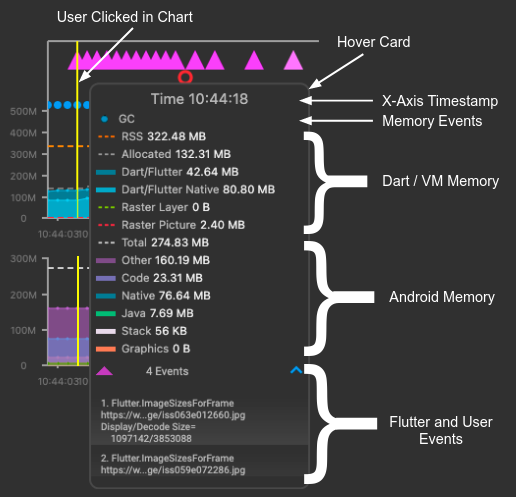
Clicking in a chart will display a vertical yellow line where the click occurred on the X-Axis (Timestamp), a hover card will be displayed with the information collected:
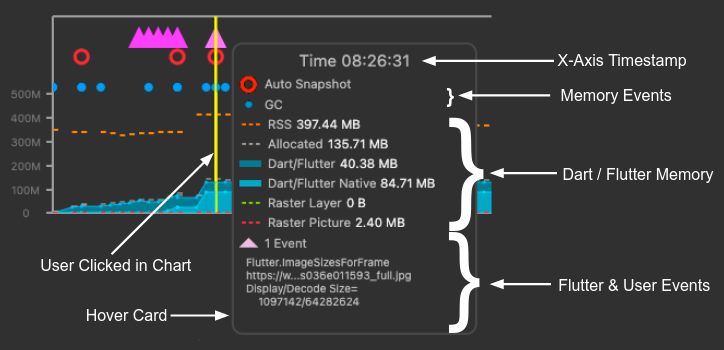
Memory Events Memory Events recorded in the Event Pane e.g., VM GC, User Initiated GC, User Initiated Snapshot, Auto-Snapshot, Allocation Monitoring and, Reset of Accumulators.
Dart / Flutter Memory Collected data Capacity, Used, External, RSS, Raster Cache (pictures/layers).
Flutter and User Events Extension events e.g., Flutter.ImageSizesForFrame, user custom events see Events.
Aggregate events, as the name implies, collects all the events nearest a particular timestamp (tick) and displays the events to the x-axis’ closest tick.
If more than one event, collected at this timestamp, a dark magenta
triangle is displayed with the aggregate list of events. The aggregate
vents collects all the events nearest a particular timestamp (tick)
and displays the events to the X-Axis closest tick. Expanding the events
will display the values for each event:

If only one event is collected, a lighter magenta triangle color is
displayed with the single event values:

If the Android memory chart is displayed then the Android collect data will displayed between the “Dart / Flutter Memory” and the “Flutter and User Events” e.g.,
Android chart
When connected to an Android app, DevTools collects Android’s ADB (Android Debug Bridge) meminfo from an ADB app summary (polled every 500 ms). This meminfo section is the most interesting at a high-level. If you were to collect this info from the ADB tool, this is what it would look like:
> adb shell dumpsys meminfo io.flutter.demo.gallery -d

 App Summary
                       Pss(KB)
                       -------
           Java Heap:     5192
         Native Heap:    11992
                Code:     2132
               Stack:       60
            Graphics:    53700
       Private Other:    42800
              System:    84493

               TOTAL:   200369       TOTAL SWAP PSS:    82168
This chart is another timeseries graph of the state of Android memory as the application is running. The quantities plotted on the y-axis are the above values (Java Heap, Native Heap, Code size, Stack size, Graphics stack, System size and total).
Clicking on a timestamp (x-position) will display all data points collected for that time period.
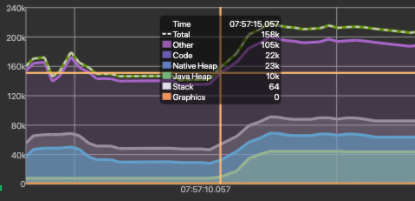
The hover card will display the values of all collected Android memory data.
- Time
- The timestamp for the current data values collected - see descriptions below.
- Total
- The total memory in use. Total memory is comprised of several different categories, all of which are plotted along the y-axis. These categories are described below.
- Other
- Other memory usage corresponds to the ‘Private Other’ field from ADB. This is memory used by the app that the system isn't sure how to categorize. Note: The Other trace is a combination of Other and System (shared and system memory usage) - corresponds to ‘System’ field from ADB.
- Code
- Code memory usage corresponds to the ‘Code’ field from ADB. This is memory that your app uses for static code and resources, such as dex byte code, optimized or compiled dex code, .so libraries, and fonts.
- Native Heap
- Native Heap usage corresponds to the ‘Native Heap’ field from ADB. This is memory from objects allocated from C or C++ code. Even if you're not using C++ in your app, you might see some native memory used here because the Android framework uses native memory to handle various tasks on your behalf. Some examples of these tasks are handling image assets and other graphics—even though the code you've written is in Java or Kotlin.
- Java Heap
- Java Heap usage corresponds to the ‘Java Heap’ field from ADB. This is memory from objects allocated from Java or Kotlin code.
- Stack
- Stack usage corresponds to the ‘Stack’ field from ADB. This is memory used by both native and Java stacks in your app. This usually relates to how many threads your app is running.
- Graphics
- Graphics usage corresponds to the ‘Graphics’ field from ADB. This is memory used for graphics buffer queues to display pixels on the screen, including GL surfaces, GL textures, etc. Note: This is memory shared with the CPU—not dedicated GPU memory.
Memory controls
At the top of the memory page, above the charts, are several buttons and dropdowns that control how memory data is displayed.

- Pause
- Pause the memory overview chart to allow inspecting the currently plotted data. Incoming memory data is still received; notice the Range selector continues to grow to the right.
- Resume
- Resume the memory overview chart so that it is live, displaying the current time and the latest memory statistics.
- Clear
- Clear all collected data from the memory profiler.
- Display
- The duration of the x-axis. For example, if this dropdown is set to "Display 5 minutes", memory data from the last 5 minutes will be displayed.
- - Display 1 Minute
- - Display 5 Minutes
- - Display 10 Minutes
- - Display All Minutes (slider disabled)
- Source
- Source can be either "Live Feed", which pulls data from the connected Flutter app, or one of the available offline data files, which are created by clicking "Export".
- Android Memory
- Displays or hides the Android Memory Chart.
- GC
- Initiates a garbage collection - compaction of the heap.
- Export
- Saves collected data for Event Timeline, Memory Overview Chart and Android Overview Chart. Files saved are displayed under the Source dropdown. Selecting a file loads the offline data.
Memory actions
Below the memory charts (Event Timeline, Memory Overview and Android Overview charts) are interactive actions used to collect and analyze information about memory usage while using the application DevTools is connected to there are two tabs:

Analysis tab
The Analysis tab collects memory snapshots both user initiated and auto-collected by DevTools, when DevTools detects memory spikes. Each snapshot is analyzed and an analysis is created too.
Analysis actions
The actions available for Analysis are:

Snapshot Clicking the Snapshot button makes a request to the Dart VM to collect the current state of memory. The memory objects can be sorted by attributes such as class name, size, allocated instances (see Snapshot classes).
Treemap If the Treemap switch is on the snapshot displays currently active memory objects, the last snapshot, memory in a high-level view as a tree map. (TBD details).
Group By Dropdown to select how data is grouped, which can either be by instance or by class name.
Collapse All Collapse all nodes in the tree table.
Expand All Expand all nodes in the tree table
Analysis and Snapshots view
All Analyses and Snapshots are displayed in a Table Tree View:
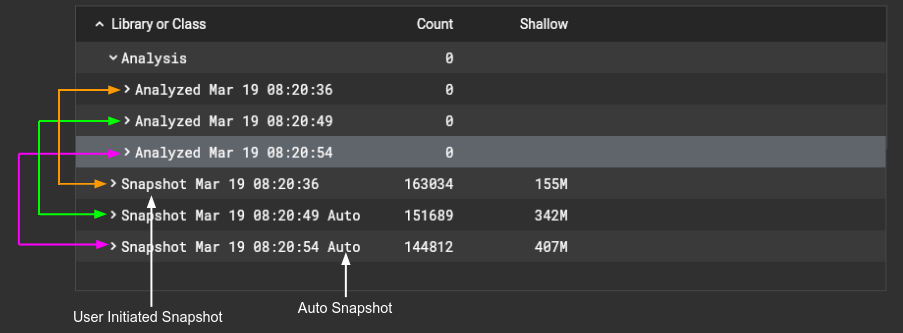
The snapshots are grouped by library and within library by class and each class will display the list of known instances for that class.
A snapshot is a complete view of all memory objects at a particular point in time. Navigating, in the tree, to a class and it’s instances (if the constructor was called to create an instance). If instances exists expanding the class will display all live instances (objects). Clicking on an instance, of a class, will bring up the memory inspector to the right-side of the table tree.
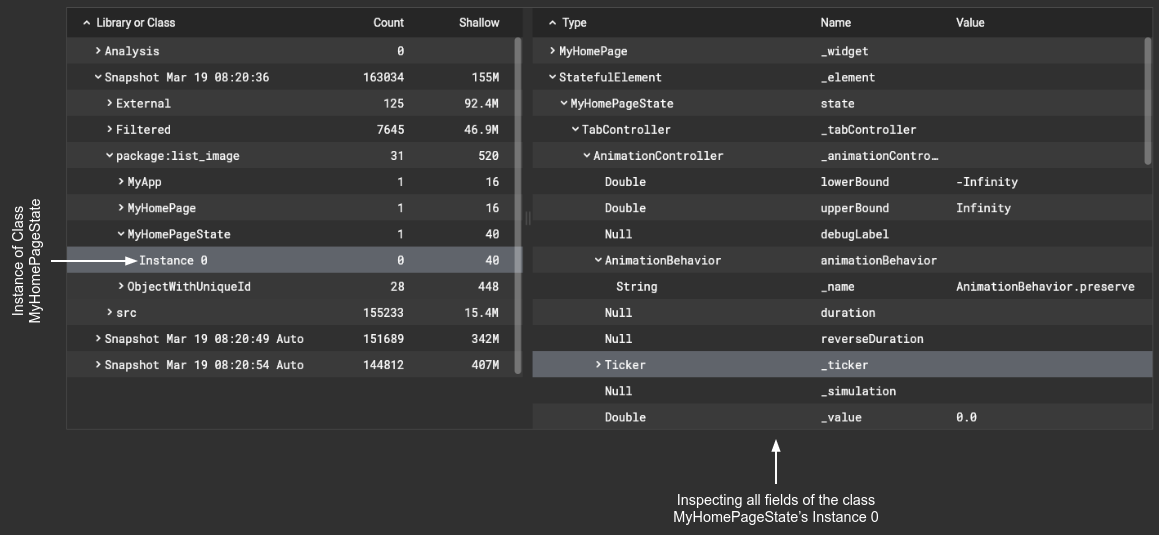
Snapshots

Clicking the Snapshot button shows the current state of the heap with regard to all active classes and their instances.
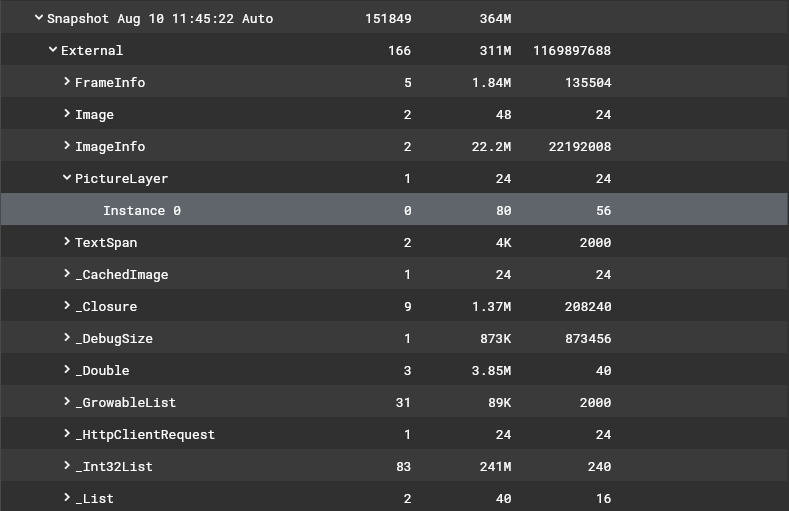
This pane shows classes allocated in the heap, all instances for a class, and the ability to inspect a particular instance.
In addition, a snapshot can automatically occur when DevTools notices a spike in memory used (growth of > 40%).
Every snapshot, manual or automatic, will generate an analysis of the snapshot e.g., groups image problems that might have occurred. In the future, other common Flutter coding issues e.g., Fonts, Files, JSON, etc. that could cause memory problems will be flagged.
- Tree View of Memory
- The tree table view displays outstanding memory events (user requested snapshots, automatic snapshots, snapshot analyses, memory allocation monitoring).
- Memory Inspector
- Display either the contents of an analysis, snapshot or monitoring based on the currently selected row in the tree view.
Snapshots have major tree nodes:
- External
-
Memory that is not in the Dart heap but is still part of the total memory footprint. Objects in external memory would be native objects (for example, from a memory read from a file, or a decoded image). The native objects are exposed to the Dart VM from the native OS (such as Android, Linux, Windows, iOS) using a Dart embedder. The embedder creates a Dart wrapper with a finalizer, allowing Dart code to communicate with these native resources. Flutter has an embedder for Android and iOS. For more information, see Dart on the Server or Custom Flutter Engine Embedders.
- Filtered
- Filter are the packages being filtered.
- Packages
- User packages used by the application and Src - the empty Dart package.
Under each of the above nodes are class nodes, an aggregate of the objects allocated to this class. Clicking a class name displays a list of class instances. and under each class are all the instances of a class. Clicking on an instance will inspect the contents of that instances (fields and values).
Inspecting a class instance in a snapshot
Expanding a class displays the active instances for that class. Clicking on an particular instance displays the type and value of the fields for that instance.
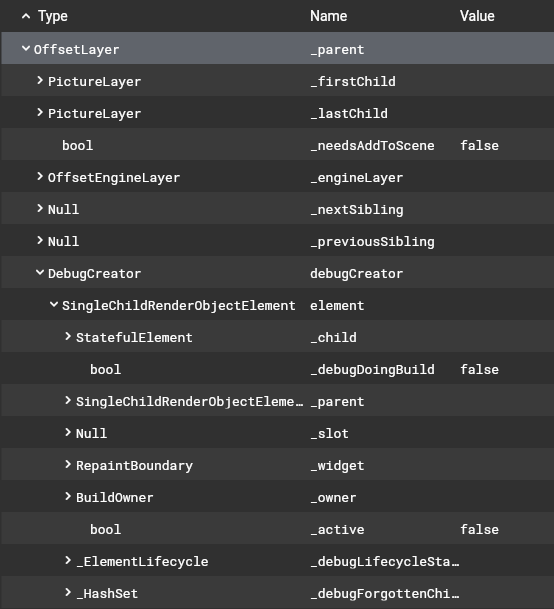
Analysis of a snapshot
Every snapshot creates a corresponding Analyzed entry under the Analysis node (the Analyzed date/time corresponds to the matching Snapshot date/time).
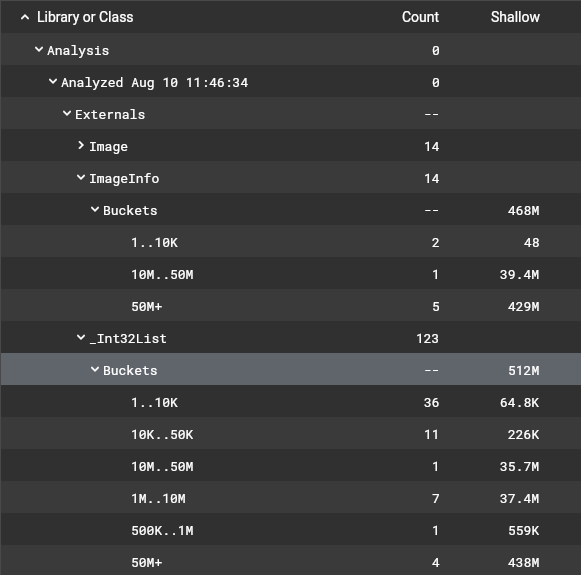
Currently, Analysis looks for common problems with images e.g., loading large files instead of scaled thumbnails, not using a ListBuilder to manage images in a list, etc.
The Analysis pulls all Image related classes and instances from a snapshot and organizes the data in one place instead of having to search for the all the classes and inspect the instances to understand what are just image related classes.
In the above Analysis the raw images are located in the Externals portion of memory _Int32List (or _Int64List for newer phones) organizes the instances sizes into buckets. Eleven images are 10K-50K, one image is 10M-50M, seven images are 1M-10M and four images are greater than 50M. For a grand total of over 500M of this app constitute images rendered as small images on a phone.
Allocation tab
The Allocation tab allows monitoring the instances of all classes, reporting the number of objects allocated and number of bytes consumed by all objects. The numbers are displayed in absolute totals as well as accumulated totals. Initially, the accumulated values (number of objects and size in bytes) are equal to the initial totals at the time of the first monitor request. The accumulators can be reset, to zero, at any time such that the next monitor request will return the accumlated values since the last reset.
Additionally, a small set of classes can track the allocation of each instance of a class. The tracking captures a stack trace when the constructor was called. The overhead to track these allocations are expensive (slow) therefore tracking should be used sparingly.
Allocation actions

- Track
-
Records and monitors the number of instances and size of all instances in bytes. Clicking the “Track” button, a table will populate with instance allocation data. For each instance in the allocation table, The “Delta” column reflects the number of memory allocations since the last reset.
- Reset
- Resets the accumulator counts (Delta columns) for each instance in the allocation table. The next time the "Monitor" button is pressed, the "Delta" columns displays the populate with the new instances and sizes since the last reset.
- Search
- The search field is enabled when the instance allocation data exists. Typing, or selecting a name from the dropdown, will navigate to that class name in the table.
- Filter
- Display a dialog box of libraries and class names to display (checked on).
Allocation view
Allocations are displayed in a table view of each class available to the connected application:
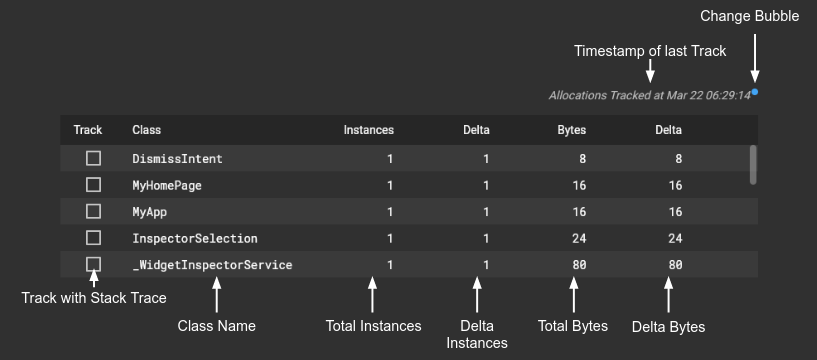
Each row displays the class name the number of instances and bytes allocated with deltas (accumulators since last reset).
- Track with Stack Trace
-
If enabled records the stack trace when the instance is created, class constructor called.
- Class Name
-
Class allocations monitored.</dd>
- Total Instances
-
Total number of active instances for the class.</dd>
- Delta Instances
-
An accumulator of change in instance count controlled by the Reset button. When Reset is pressed the accumulators rest to zero then each time the Track button is pressed the current totals and deltas are updated.
- Total Bytes
-
Total number of bytes allocated of all instances for the class.</dd>
- Delta Bytes
-
An accumulator of change in instance bytes created controlled by the Reset button. When Reset is pressed the accumulators rest to zero then each time the Track button is pressed the current totals and deltas are updated.
- Timestamp of Last Track
-
The time when the Track button was pressed.</dd>
- Change Bubble
-
Small bubble to indicate the changes collected have been collected and updated in the table.
- Classes
-
Active classes in the heap.</dd>
- Instances column
- Total active objects (instances) for all classes in the heap
- Delta column
- Accumulator counts of all instances since last "Reset" was pressed. Clicking the Reset button initializes the accumulated (Delta) instances of a class. This is useful for finding memory leaks.
- Bytes column
- Total bytes consumed for all instances of a class in the heap.
- Delta column
- Accumulator counts bytes allocated since last "Reset" was pressed. Clicking the Reset button initializes the accumulated (Delta) bytes for all instances of a class. This is useful for finding memory leaks.
- ENTER
-
Selects the highlighted line (GlobalObjectKey) and navigates to the row with that class name in the active tree table (Snapshot) or table (Allocations).
- UP/DOWN arrows
-
Rotates through the list of possible matches highlighting the next item in the list.
- ESCAPE
-
Clears and cancels all searching.
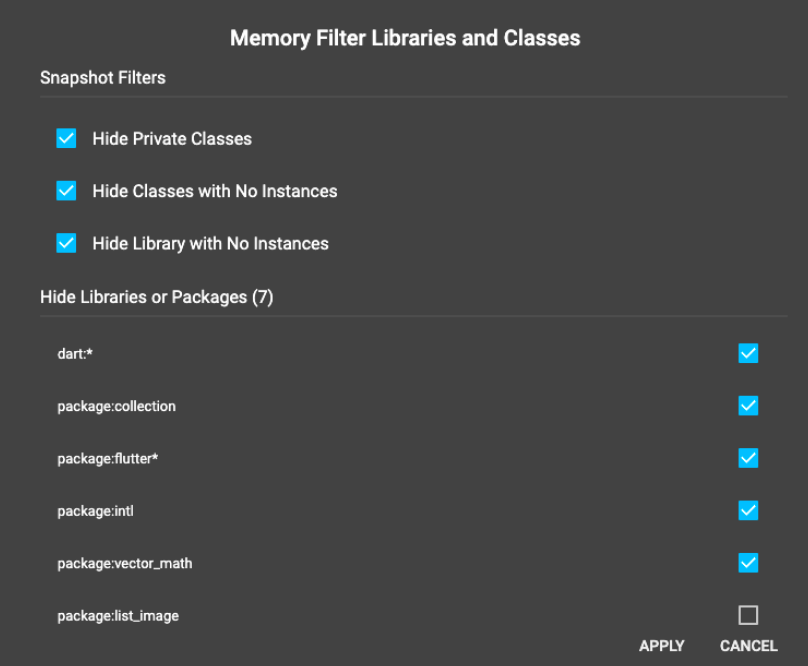
- Hide Private Classes
-
Class names prefix with an underscore.</dd>
- Hide Classes with No Instances
-
Classes never constructed are filtered.</dd>
- Hide Libraries with No Instances
-
All classes in a library never constructed the library is filtered.</dd>
- Hide Libraries or Packages
-
List of all libraries used in your application are displayed. By default the libraries enabled above are filtered out (dart:, package:flutter, etc.). The libraries automatically filtered can be enabled if you are interested in Dart core libraries and classes or the Flutter framework.
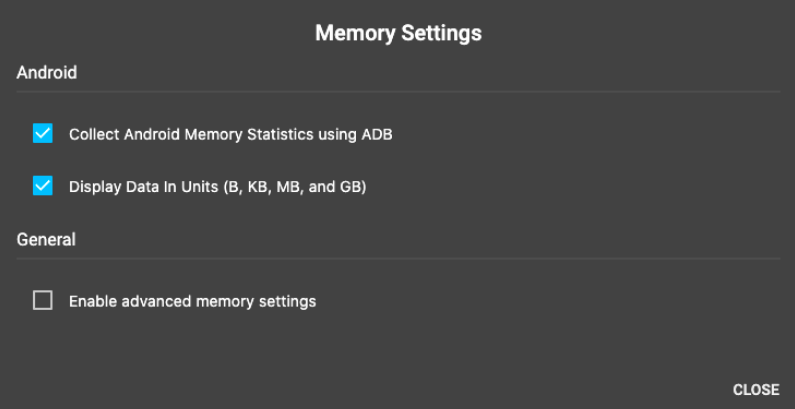
- Collect Android Memory Statistics using ADB
-
By default if DevTools is connected to your application via an Android device/emulator then Android memory statistics are not collected. Collecting with ADB can be expensive and may hide performance issues in your app.
- Display Data in Units (B, K, MB, GB)
-
By default data displayed in the hover card are scaled using units instead of raw values. Turning off this will display the raw numbers e.g., 125M would display as 125,235,712
- Enable advanced memory settings
-
If enabled, the GC button is displayed to ask the VM to garbage collect memory (manually). This manual GC is only a request to the VM. The VM may decide to do no compaction, some compaction or complete compaction of the heap.
- Garbage collection (GC)
- GC is the process of searching the heap to locate, and reclaim, regions of "dead" memory—memory that is no longer being used by an application. This process allows the memory to be re-used and minimizes the risk of an application running out of memory, causing it to crash. Garbage collection is performed automatically by the Dart VM. In DevTools, you can perform garbage collection on demand by clicking the GC button.
- Heap
- Dart objects that are dynamically allocated live in a portion of memory called the heap. An object allocated from the heap is freed (eligible for garbage collection) when nothing points to it, or when the application terminates. When nothing points to an object, it is considered to be dead. When an object is pointed to by another object, it is live.
- Isolates
-
Dart supports concurrent execution by way of isolates, which you can think of processes without the overhead. Each isolate has its own memory and code that can’t be affected by any other isolate. For more information, see The Event Loop and Dart.
- Memory leak
- A memory leak occurs when an object is live (meaning that another object points to it), but it is not being used (so it shouldn't have any references from other objects). Such an object can't be garbage collected, so it takes up space in the heap and contributes to memory fragmentation. Memory leaks put unnecessary pressure on the VM and can be difficult to debug.
- Virtual machine (VM)
- The Dart virtual machine is a piece of software that directly executes Dart code.
</dl>
For more information see Allocation Tracking.
Managing the objects and statistics in the heap (Monitor Allocations)

Clicking the allocation Track button monitors the total number of instances and total number of bytes allocated for a class. In addition, two accumulators are maintained for instances and bytes allocated these accumulators can be reset, to zero, by user action (pressing the Reset Accumulators button). The mechanism is useful to find memory leaks.

When the Reset button is pressed, the accumulators for all classes resets to zero. When reset is occurs a “monitor reset” event to the Event Timeline. Clicking the Reset button again resets both accumulators to zero.
</dl>
Allocation tracking
In addition to tracking the number of objects and bytes consumed for all instances of a class, a stack trace can be recorded when a class’s constructor is called to help narrow where allocations might be astray. To do this enable the Track checkbox for a class e.g.,
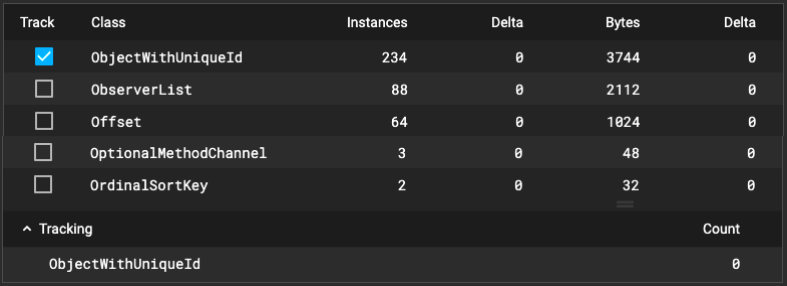
Interact with your application then when you want to view the instances allocation press the “Track” button again. This will update the count for the instances being tracked e.g., 118 in the below figure. Expanding the instances tracked will display all the instances and timestamp when each instance was created e.g.,
![]()
Selecting an instance will display the call stack at the time the class’s constructor (allocated) was called e.g.,
![]()
Filtering, Searching and Auto-Complete
Both the Analysis and Allocations tabs support searching and filtering Begin typing in the name of the class you’d like to find e.g., ObectWithUniqueId will return a list that matches the characters typed so far. The first item in the list is highlighted.
Pressing a keystroke when auto-complete is visible:
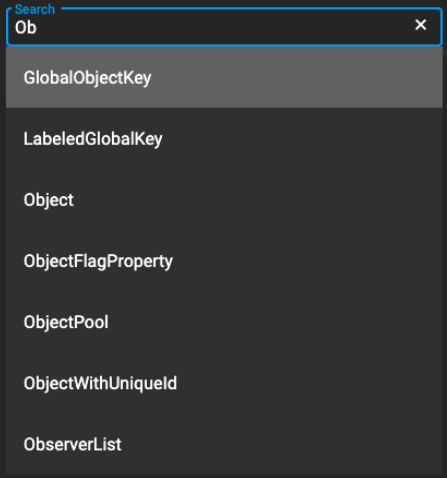
Typing more characters would narrow down the possible class names e.g., typing Obje displays:
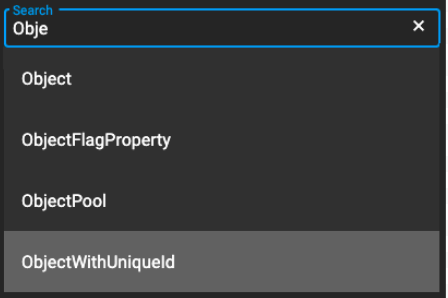
Finally, typing ObjectW displays the exact match:

Filtering
Filtering is used to move libraries and classes from the main list (tables) to a Filter group to help reduce the number of classes visible that are less important while profiling memory.
</dl>
Setting
The Memory profiler has a specific settings dialog:
Memory problem case study
Memory leak study using large network images was added with step-by-step instructions on using DevTools Memory profiler, detecting the memory problem and fixing the problem, see case study.
Glossary of VM terms
Here are some computer science concepts that will help you better understand how your application uses memory.